.png?width=300&height=69&name=Logo%20SmartGuide%20horizontal%20(1).png "SmartGuide")
As a professional tour guide, I was wondering how to offer an alternative product to my personal...
Knowledge is power. To attract more visitors and grow your impact, it’s crucial to know the behavior and activity of your current visitors. Comprehensive heatmaps of visitors’ behavior can help with that, and enable data-driven visitor management in your destination or tourist attraction. Start seeing your visitors’ behavior from different angles.
There’s no need to be or become a data scientist to make decisions based on data. With today’s technologies and means of data visualization, it’s quite easy to get oriented and discover interesting trends in your visitors’ behavior.
Operating with hard data instead of just presumptions is also crucial when applying for grant schemes. Any presumptions you have about how your visitors behave, who they are, or which language they speak, can be confirmed or denied.
Forecast the tourists' behavior and adapt based on hard data
The SmartGuide platform enables destinations, attractions and travel businesses to base their decisions on data from several big data dashboards. One dashboard however stands out when it comes to straight-forward visualization of user activity: the heatmaps.
SmartGuide heatmaps allow insights into visitors’ behavior in specific time frames and can be further broken down based on visitors’ language.
The heatmaps below, for example, depict how seasonality impacts the movement of American, French, German and Czech tourists in the Czech Republic in winter vs. summer. The comparison confirms the natural presumption that the movement of tourists generally declines in winter:

.png?width=960&height=540&name=SMG%20Heatmaps%20insights%20-%20examples%20(2).png)
This means of data visualization, however, can also answer more in-depth queries.
What is the visitors’ actual movement? What places interest them? Is there a difference in behavior amongst various nationalities?
In the case of American tourists visiting the Czech Republic, as visualized on the heatmaps above, we can see that they limit their movement to Prague and its closest surroundings in winter, while they make extensive trips around the entire country in summer.
Influence tourist behavior with tailor-made content
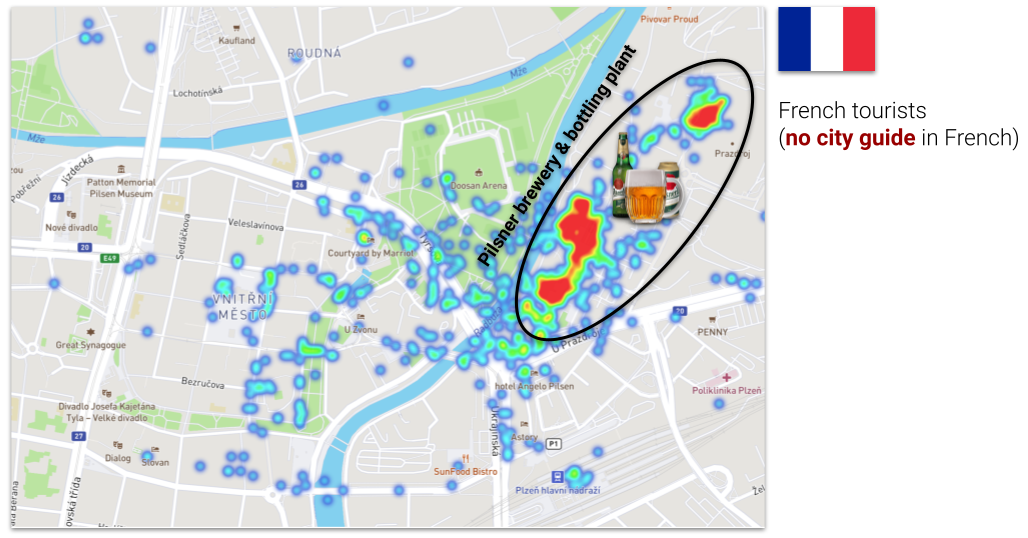
Pilsner Urquell gave the name to the most famous beer category in the world and its brewery is located in the Pilsner city center outskirts. The brewery has been using SmartGuide to provide brewery tour audio guides in various languages to international tourists.
The heatmap below shows the movement of French tourists around the city of Pilsen - they can be seen mostly around the Pilsner brewery:
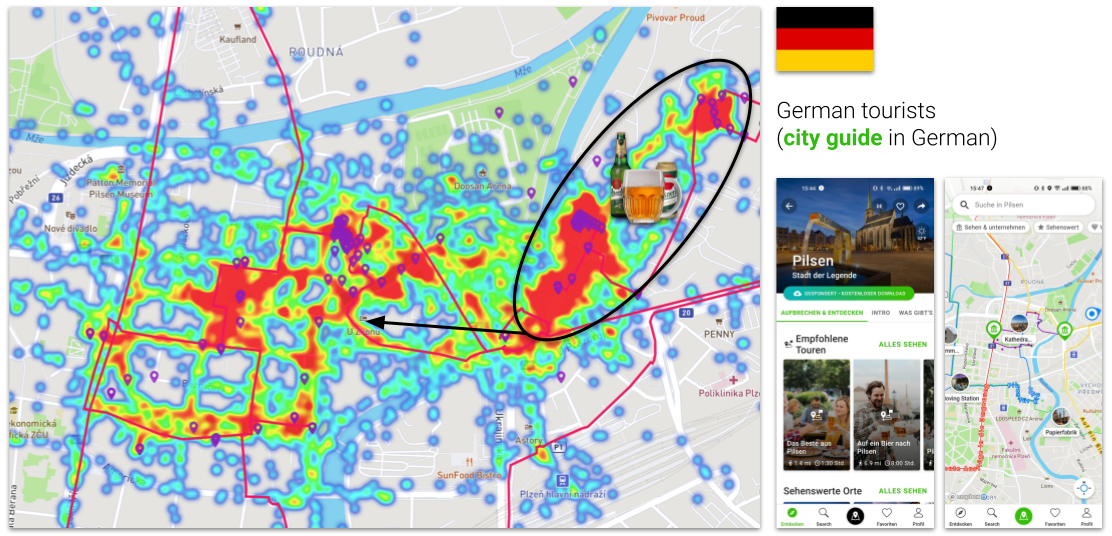
But look what happened when Pilsen city joined SmartGuide and published a German guide covering the entire Pilsen area - tourists had the motivation to explore the town, and the city got more precise data about German tourists' behavior:
“SmartGuide helps both big cities to moderate overtourism and small towns to inspire visitors to come and spend more time there.”
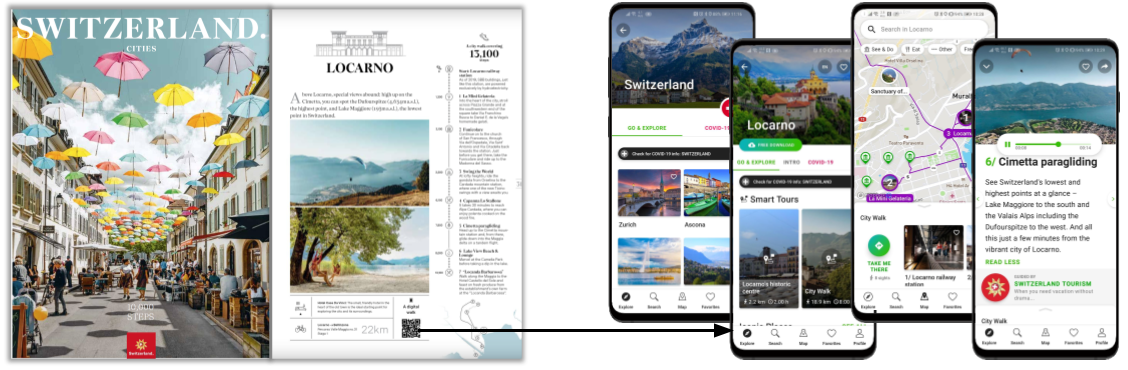
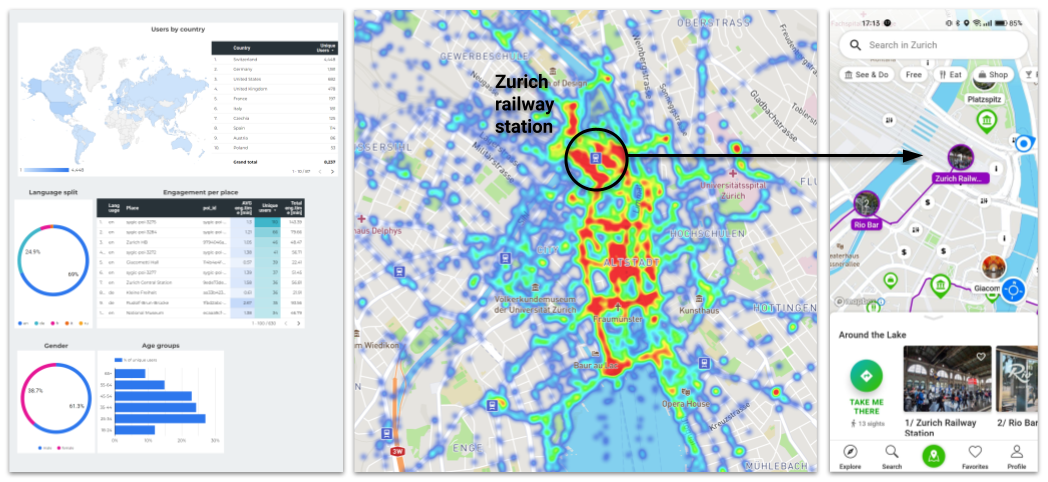
Switzerland Tourism digitized 24 city guides with 38 self-guided tours in 4 languages in just 6 weeks. Thanks to the aggregated user data from SmartGuide users, they can better understand how tourists explore Zurich. This enables Switzerland Tourism to design the right content.
We found out, for example, that most tourists exploring Zurich come from the train station, not from downtown. So we adjusted the content based on this finding, and there are now self-guided tours starting right at the Zurich train station.
See how content marketing activities change tourist behavior
Many destinations have used SmartGuide to guide tourists to less visited places and now can see the effect of such initiatives thanks to comparing heatmaps from different time frames - before and after publishing the new content on SmartGuide.
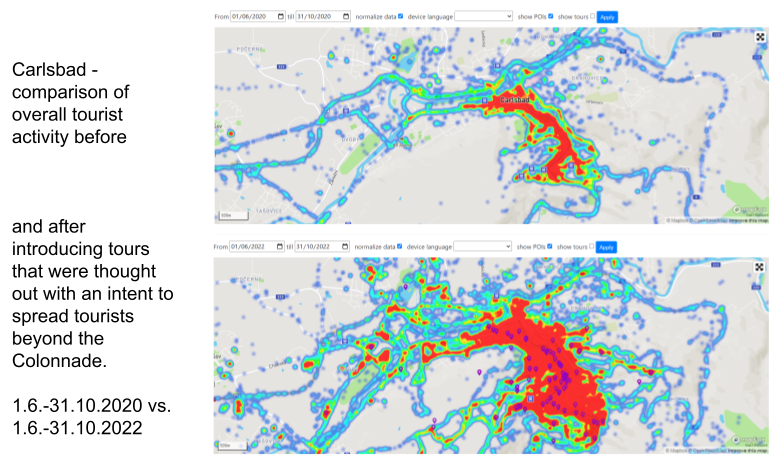
This is visible when analyzing the tourist behavior in Karlovy Vary before and after publishing new content that aimed to spread tourists beyond the Colonnade. After introducing new multilingual audio tours on SmartGuide, the visitors indeed started to explore local hidden gems:
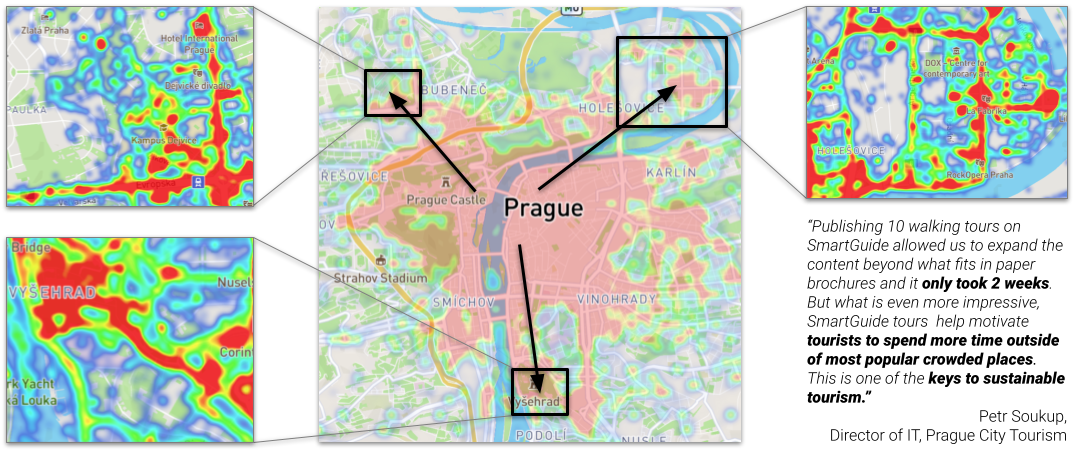
Prague City Tourism digitized its paper brochures on SmartGuide and then about 10 more authors joined to publish their stories. As a result, there are now over 400 places available in English on SmartGuide all around Prague.
Interesting stories about less visited places have inspired users to spend 30% of their time outside of Prague’s crowded city center.
“Publishing 10 walking tours on SmartGuide allowed us to expand the content beyond what fits in paper brochures and it only took 2 weeks. But what is even more impressive, SmartGuide tours help motivate tourists to spend more time outside of the most popular crowded places. This is one of the keys to sustainable tourism”, said Petr Soukup, the director of Prague City Tourism.
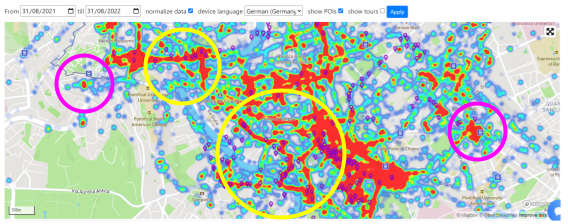
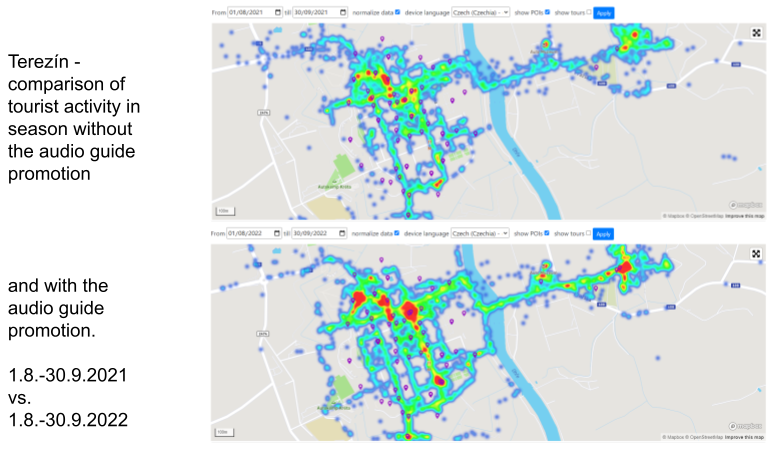
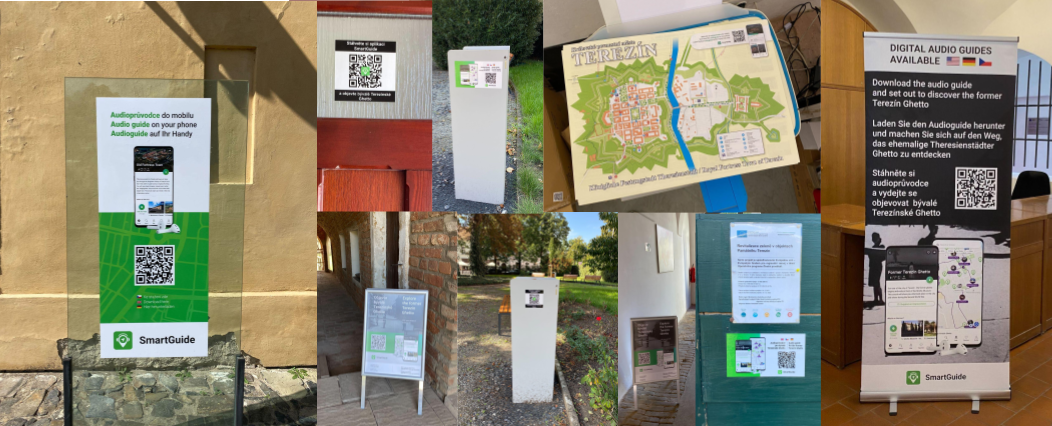
The Terezín Memorial implemented SmartGuide to provide visitors with comprehensive audio guide content in several languages. To inspire visitors to install SmartGuide and consume the content, Terezín promoted the audio guide significantly with various marketing collaterals on the main entry points as well as throughout the town’s area (such as printed maps, posters, rollups, or A-stands, etc.).
The before and after heatmaps below hint at the busiest entry points and indicate that more visitors consume the audio guide content after the marketing collaterals were placed.
Unlock the power of big data in tourism - Talk to us about premium access!
See your visitors’ (peculiar) behavior under the microscope
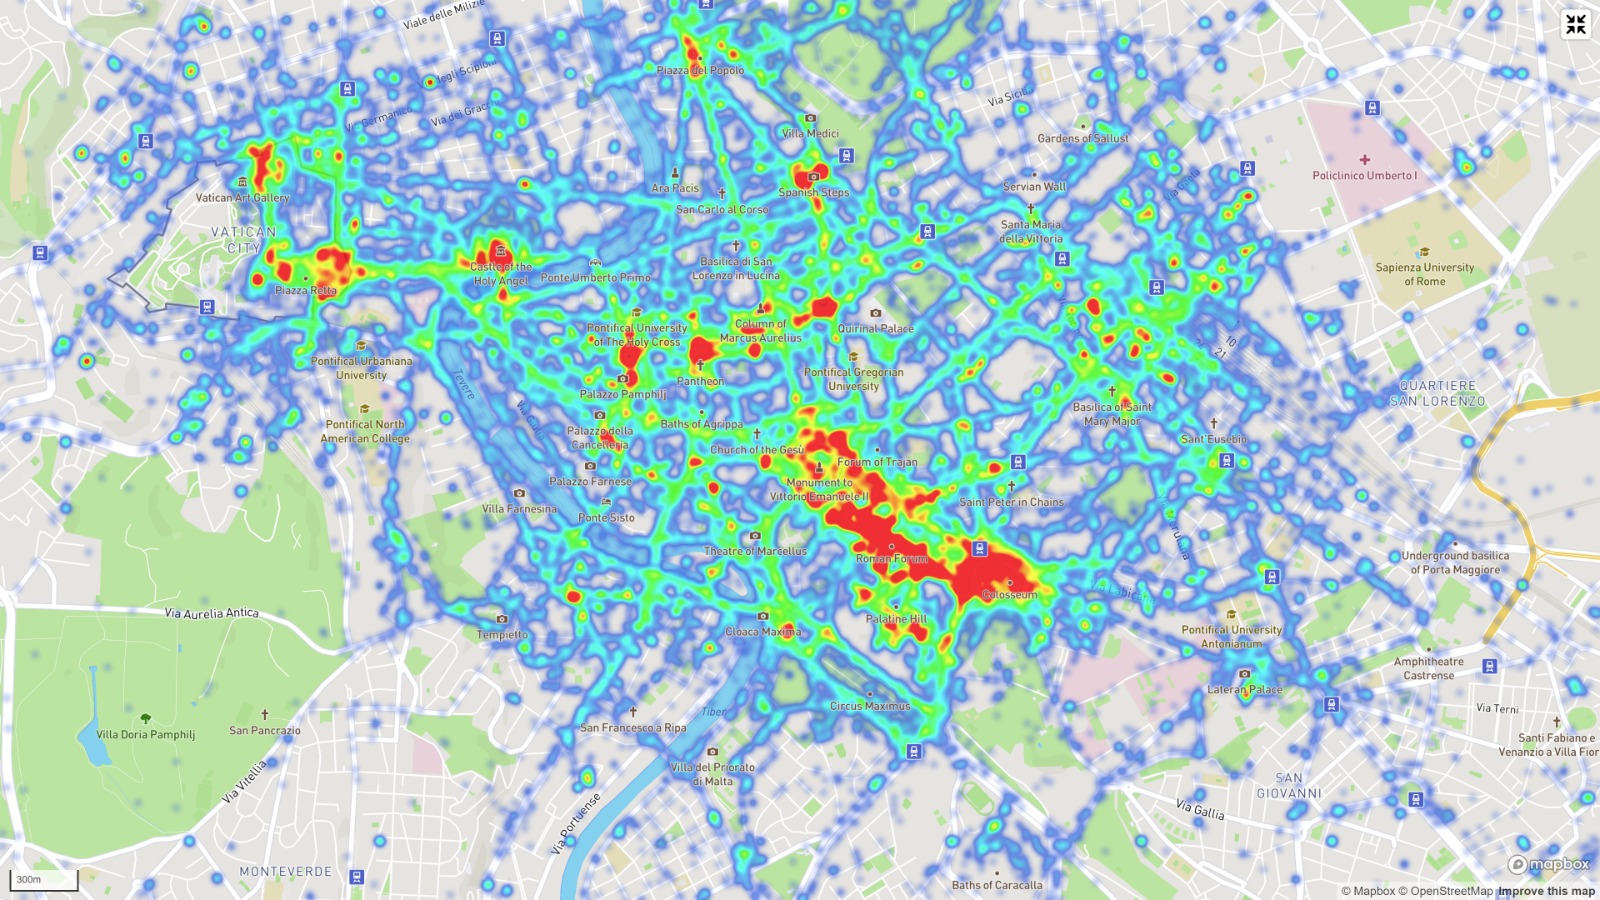
Some tourism boards have used heatmaps of tourists from telecom operators. These monitor to which base transceiver station (BTS) your phone connects. Base stations are hundreds of meters or even kilometers apart which limits the accuracy. SmartGuide heatmaps are based on GPS data with a few meters of accuracy, allowing a whole new level of insights.
Sometimes, an interesting behavior can be uncovered when we deep-dive into the detailed heatmaps and look closely at some streets or places of interest.
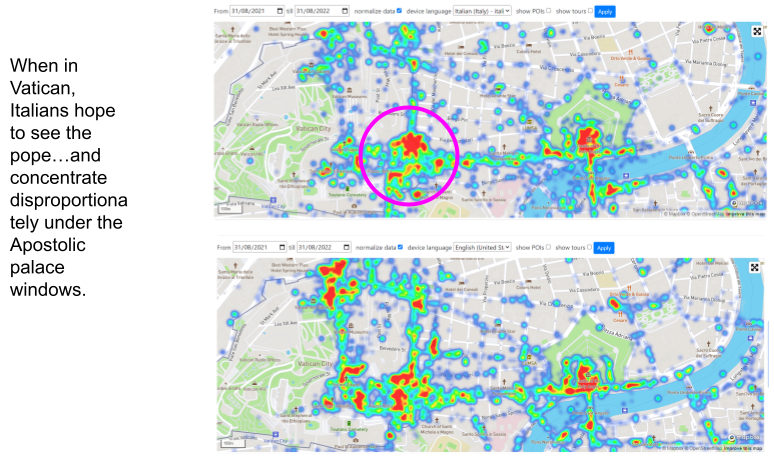
For example, when we zoom into central Rome, we can observe that Italians have a relatively low interest in the Vatican museum. Or, that when in the Vatican, Italians hope to see the Pope… and concentrate disproportionately under the Apostolic palace windows.
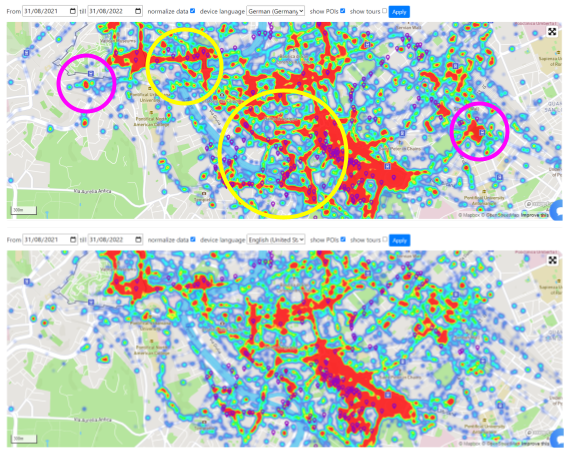
Also, Italians are probably less attracted by ancient Roman sights compared to other audiences and have relatively low interest in e.g. Forum Romanum.
Germans, on the contrary, explore the city from top to down. They explore beyond St.Peter's square, Colosseum, or Forum Romanum. They are also interested in the relatively less visible attractions, such as Bocca della Verita. Also, in comparison with American tourists, Germans rely on public transport and walk the city more.
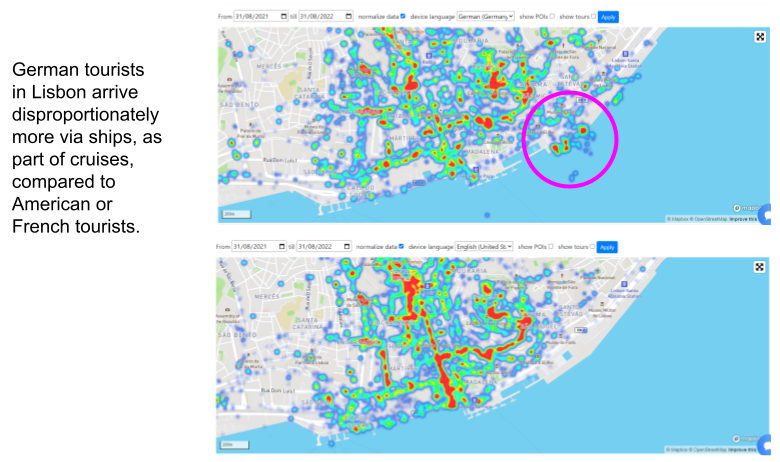
In Lisbon, German tourists arrive disproportionately more via ships, as part of cruises, compared to American or French tourists. They also visit Sintra or Cabo da Roca, the westernmost point of continental Europe, much less in comparison with French, Spanish, or American tourists.
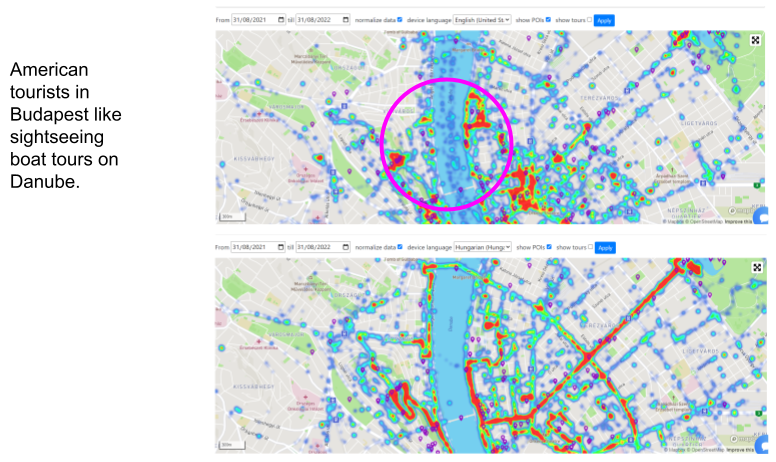
And when American tourists visit Budapest, they like to take sightseeing boat tours on the Danube, but few Hungarians join these touristy tours.
How to get the visitors’ behavior heatmaps? Publish a digital audio guide.
SmartGuide visitors’ behavior heatmaps are based on the activity of SmartGuide users.
So, to get the heatmaps about your visitors, you need to publish your digital guide on the SmartGuide platform first.
You can publish your digital audio guide yourself within a few hours in our self-service content management system for free. If you want to save time, the SmartGuide team is ready to publish a turnkey guide for you.
Once your digital audio guide is published on SmartGuide, the user activity gets logged to make a foundation of your visitors’ behavior data. All data is aggregated and anonymized to comply with GDPR. The periodical data insights and heatmaps analysis are included in the SmartGuide Prime package.
.jpg?width=554&height=312&name=CTA%20banners%20for%20SMG%20blog%20(5).jpg)
Are you interested in getting SmartGuide heatmaps? Get started! Contact us today and offer the ultimate digital audio guide to your customers with SmartGuide!